Featured Projects
Discover a variety of projects that reflect my experience with data analytics, visualisation, and geospatial techniques, spanning a range of tools including R, Python, and more.
Click Each tab to see the featured projects, and follow the link at the top for a more detailed walkthrough.
-
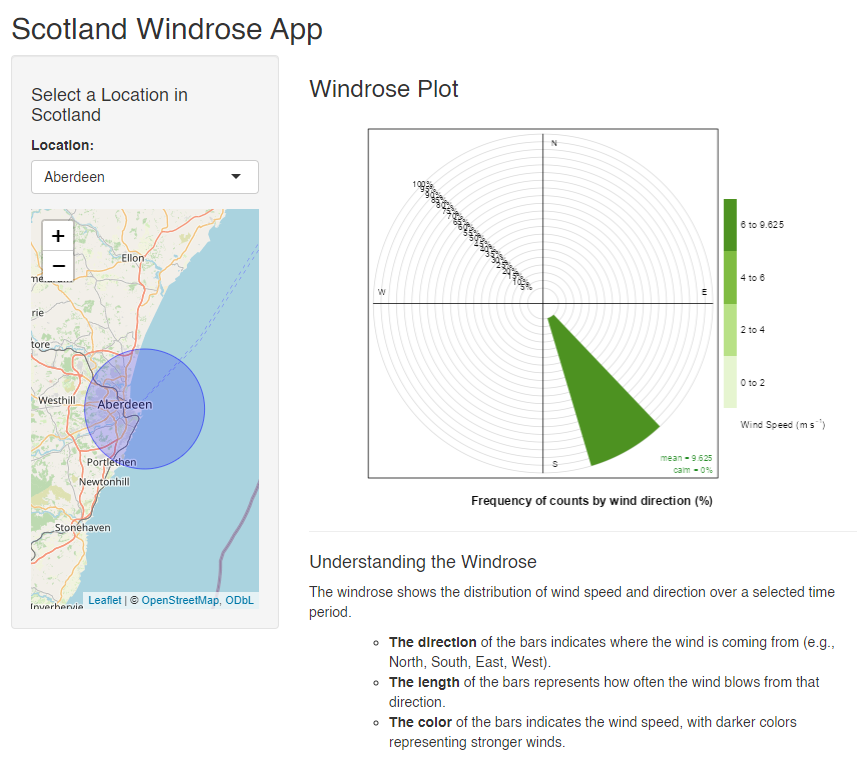
»Project 1« Interactive Shiny App in R: Visualising meteorological data through windroses for specific locations and time periods.
-
- Developed using Shiny for dynamic data visualisation.
-
- Allows users to explore weather trends with interactive windrose plots.
-
- Data input from specific meteorological stations and time periods.
- Data input from specific meteorological stations and time periods.
-
-
- THIS_PAGE_IS_UNDER_CONSTRUCTION
-
Interactive Shiny App in R: Analysing infection rates and deaths during the COVID-19 pandemic.
- Interactive Map: Users can select a region in Scotland to view COVID-19 data.
- Time Series Plots: Visualize trends in infection rates and deaths over time.
- Data Filters: Filter data by date range, health board, or specific metrics (e.g., cases, deaths, hospitalizations).
-
Colorblind-Friendly Design: The dashboard uses a custom color palette for better accessibility.
-
- THIS_PAGE_IS_UNDER_CONSTRUCTION
-
KPI Dashboard: Developed using Tableau to track and present key performance indicators for business operations.
- Features interactive visualisations, custom filters, and drill-down capabilities.
- Designed to monitor metrics such as revenue, customer satisfaction, and sales performance, using simulated data created in R.
-
- THIS_PAGE_IS_UNDER_CONSTRUCTION
-
GIS Visualisation: Leveraging R’s geospatial packages to analyse and visualise deforestation trends in Poland using the Global Forest Change (GFC) 2000-2023 dataset.
- Features 3d map, time series analysis, and forest loss/gain visualisations.
- Designed to raise awareness about deforestation and its environmental impact, inspired by the work of Simona Kossak and Milos Popovic.
-
- THIS_PAGE_IS_UNDER_CONSTRUCTION
-
Stock Market Analysis and Prediction: Leveraging Python’s data science libraries to analyze historical stock data and predict future prices.
- Features data fetching, trend visualization, and predictive modeling using machine learning.
-
Designed to provide actionable insights for investors, using publicly available stock data from
yfinance.